Self-Hosted
Smart Home
Personal homelab · Home Assistant + Zigbee2MQTT, observed end-to-end · Ongoing
Overview
A self-hosted smart home running on a home server, built from open-source pieces instead of a vendor cloud. Home Assistant is the brain; Zigbee2MQTT is the bridge to the physical devices; Mosquitto carries the messages between them; and everything sits behind Caddy for TLS and routing.
On top of that, the whole stack is observed: Prometheus scrapes container and host metrics, Grafana visualises them, and Alertmanager pages me by email when something misbehaves. The same box also serves this website.
Smart Home
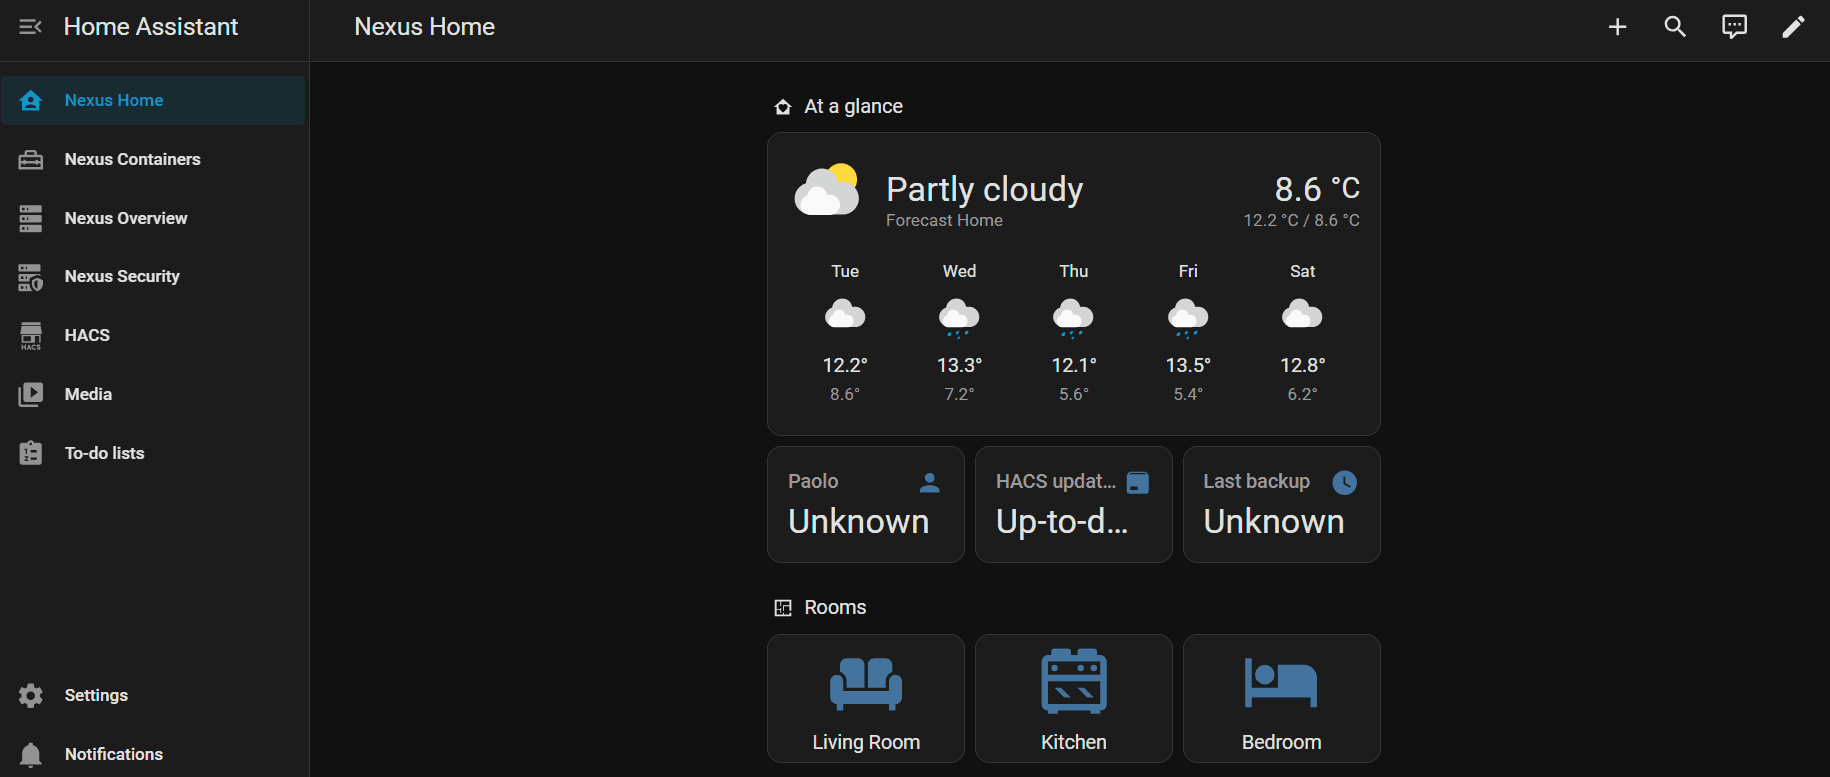
Home Assistant runs everything: device state, dashboards, automations, and the integrations to third-party services. The dashboards are organised per room with an overview page that surfaces the things I look at most often.
Physical devices talk Zigbee, not Wi-Fi. A USB Zigbee adapter plugs into the host, Zigbee2MQTT translates Zigbee radio frames into MQTT messages, publishes them onto Mosquitto, and Home Assistant subscribes. Nothing leaves the local network: no vendor cloud, no Alexa/Google middleman, no per-device app.
Authentication is required on every layer that touches the network. Mosquitto refuses anonymous connections, Caddy fronts everything with HTTPS, and remote access goes through Tailscale rather than a public port-forward.
Monitoring
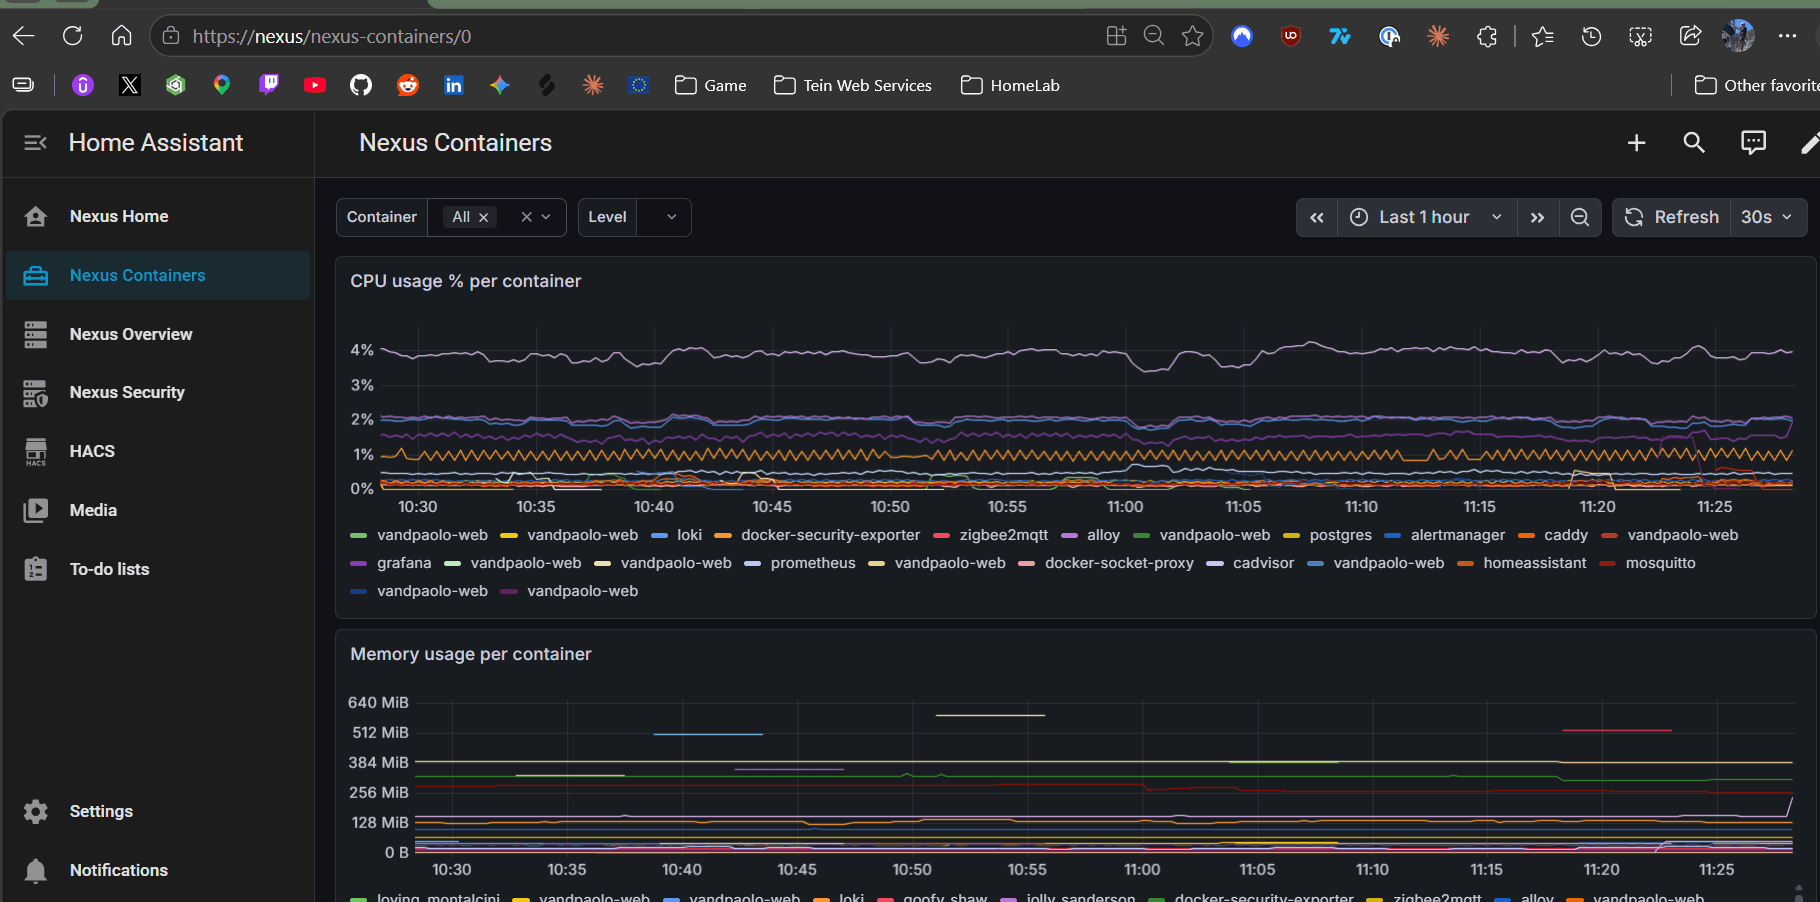
Visibility was the second priority after the home stack itself. Prometheus scrapes metrics from cAdvisor (per-container CPU/memory/IO), node_exporter on the host (CPU, RAM, disk, filesystem, temperature), and a small docker-security-exporter I wrote that flags privileged containers, root users, and sensitive bind-mounts.
Grafana visualises the lot. Alertmanager handles the alerting side with severity routing (critical/high alerts repeat aggressively, warnings less so), and SMTP credentials are injected at startup so they never live inside the container image or in the repo.
Host-level checks (pending security updates, file permission drift on /etc/shadowand friends) run as a hardened systemd timer and feed Prometheus through node_exporter's textfile collector.
Architecture
The stack runs across four Docker networks (ingress, application, IoT, and an internal-only monitoring network with no external routing), plus two host-level systemd services. Ingress is the only thing the outside world ever sees.